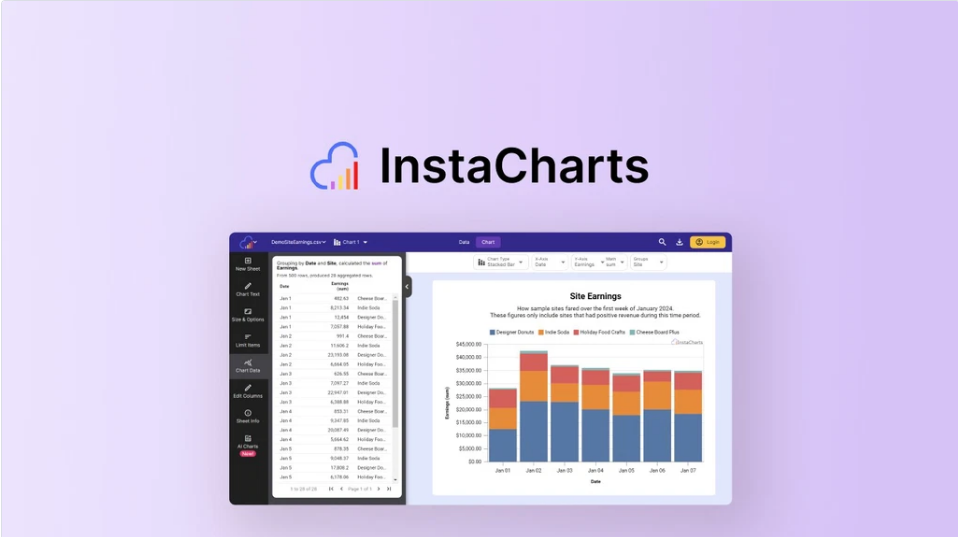
InstaCharts is here to make data easy for everyone. With just a one-time payment, you can create stunning charts instantly. No need for endless menus or tricky tools. Let’s explore how this amazing tool works and why it’s perfect for consultants, marketers, and freelancers.
What Is InstaCharts?
InstaCharts is a simple tool for turning data into charts. Upload your spreadsheet file, and the tool does the rest. It quickly recognizes common file types like Excel, CSV, TSV, or JSON. Your data is shown in a clear table, ready to explore.
You can save your chart as an image or share it online. Interactive charts can even be embedded into websites.
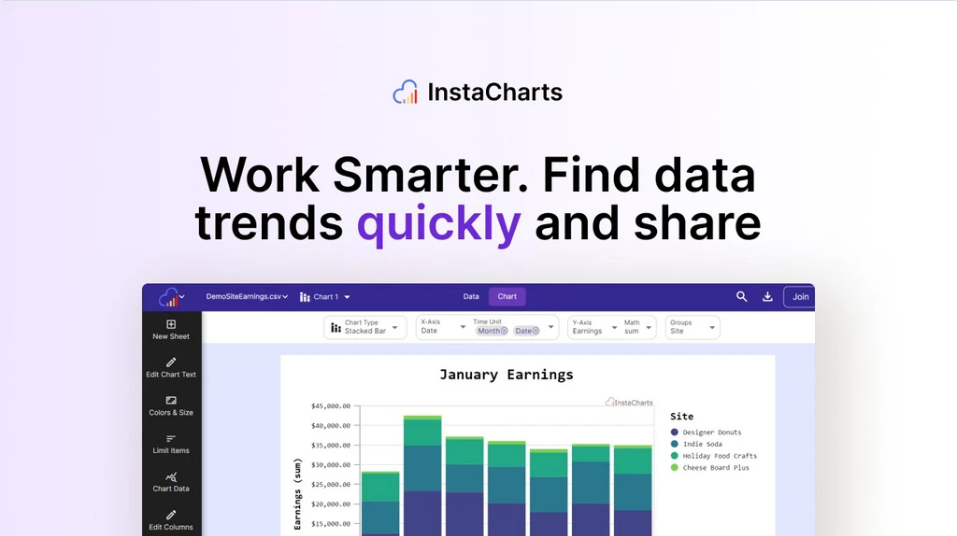
How Does InstaCharts Work?
It’s super simple. Follow these steps:
- Upload Your File
Drag and drop your spreadsheet. No advanced settings needed. - View Your Data
See your information in an easy-to-read table. Sort, filter, and explore. - Create a Chart
InstaCharts detects your data format. It auto-generates a chart. - Customize Your Chart
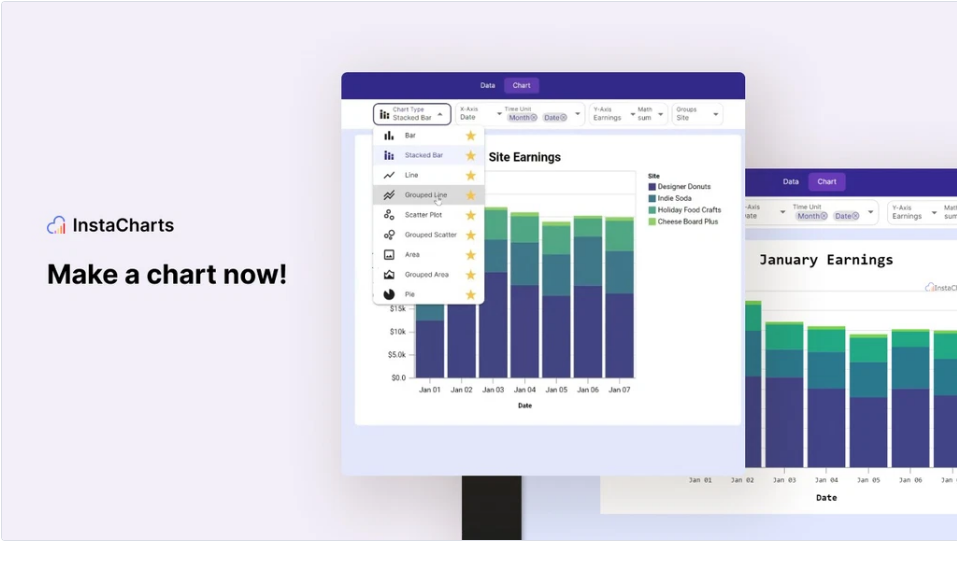
Use the simple design controls. Change colors, labels, and chart types. - Share or Save
Share your chart through a public link or save it as .png or .svg.
Why Use InstaCharts?
Save Time and Effort
No need to spend hours on complex software. InstaCharts simplifies everything.
Instant Insights
See trends in your data right away. Spot patterns quickly.
Share Easily
Public links let you share charts with teams or clients.
Embed Anywhere
Add charts to your website or presentation.
Lifetime Access
Pay once. Use it forever.
Key Features
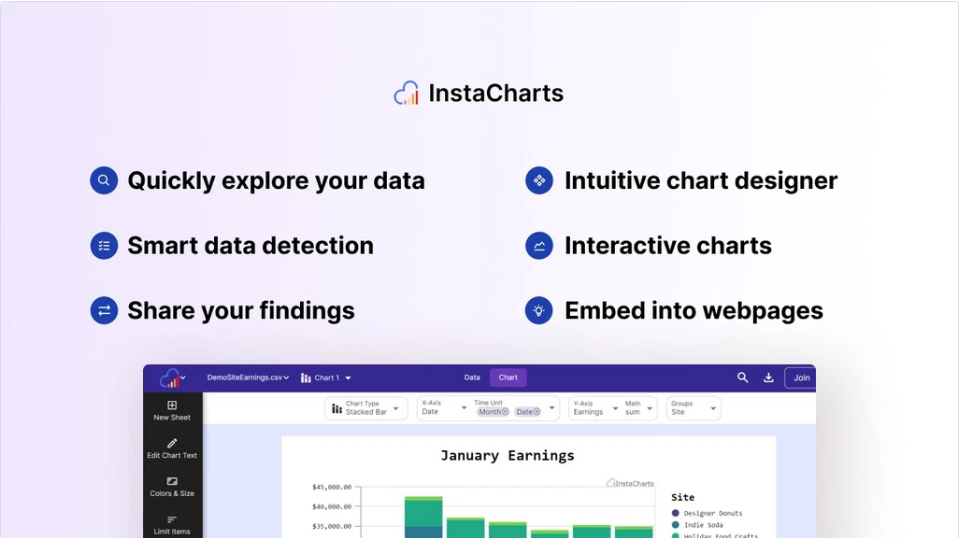
Auto-Detects Data Formats
Upload your file, and InstaCharts recognizes your data type. It understands numbers, dates, and text instantly.
Interactive Charts
Hover over data points to see detailed info. It’s great for making presentations more engaging.
Export Options
Save charts as .png or .svg images. Export filtered data to .csv or .json formats.
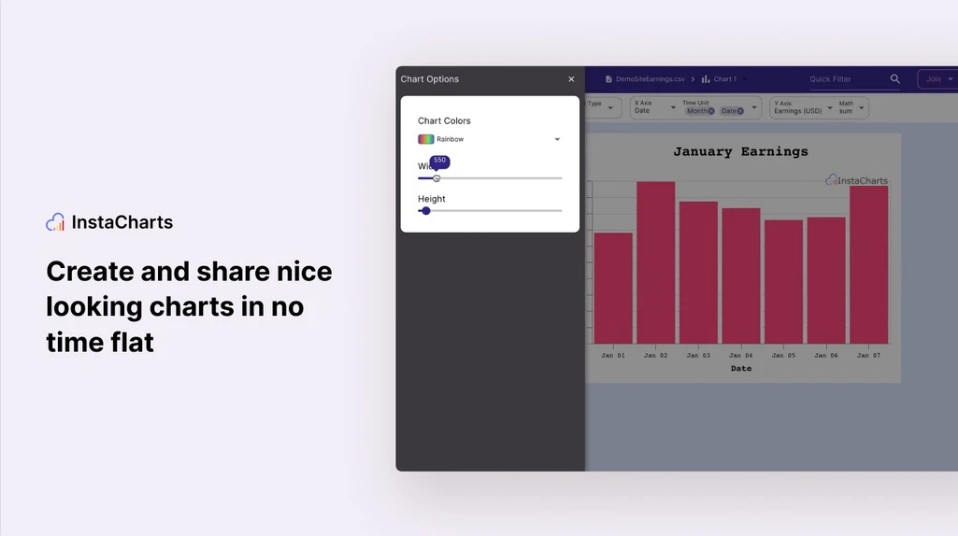
Simple Design Tools
Change your chart style with easy controls. Adjust labels, colors, and layouts without any hassle.
Best Use Cases
InstaCharts is ideal for anyone working with data. Here’s how different professionals can use it:
Consultants
Show client data trends in seconds. Share results with clients through links or images.
Freelancers
Make projects look professional. Use charts in your reports or websites.
Marketers
Analyze campaign performance. Share interactive results with teams.
Two Affordable Plans
InstaCharts offers two plans to fit your needs:
Plan 1: $29
- One-time payment.
- Export charts as images.
- 1,000 shared views per month.
- Up to 10 MB file uploads.
- Process 25,000 rows per file.
Plan 2: $58
- One-time payment.
- All Plan 1 features.
- 100,000 shared views per month.
- Up to 20 MB file uploads.
- Process 100,000 rows per file.
Both plans include lifetime access and a 60-day money-back guarantee.
Benefits of InstaCharts
- No Subscription Fees
Pay once and enjoy lifetime use. - User-Friendly
Perfect for beginners. No training required. - Compatible File Types
Works with Excel, CSV, TSV, JSON, and more. - Interactive Sharing
Share charts that others can interact with online. - Secure and Private
Only people with your chart link can access it.
Frequently Asked Questions
Q: What file formats does InstaCharts support?
A: It works with Excel, CSV, TSV, JSON, and other common formats.
Q: Can I embed charts into my website?
A: Yes, you can embed interactive charts directly into webpages.
Q: Is there a storage limit?
A: Yes, Plan 1 includes 100 MB of storage, while Plan 2 offers 500 MB.
Q: Can I try it before committing?
A: Yes, there’s a 60-day money-back guarantee.
Final Thoughts
InstaCharts is an easy, affordable way to turn spreadsheet data into beautiful charts. It’s perfect for professionals who need quick insights and simple sharing options.
Stop wasting time on complex tools. Start creating charts with InstaCharts today.
Get started now with a one-time payment! Choose your plan and create charts faster than ever.
